3 min read · October 12, 2027
How to Calculate Annual Rate of Return on Any Investment
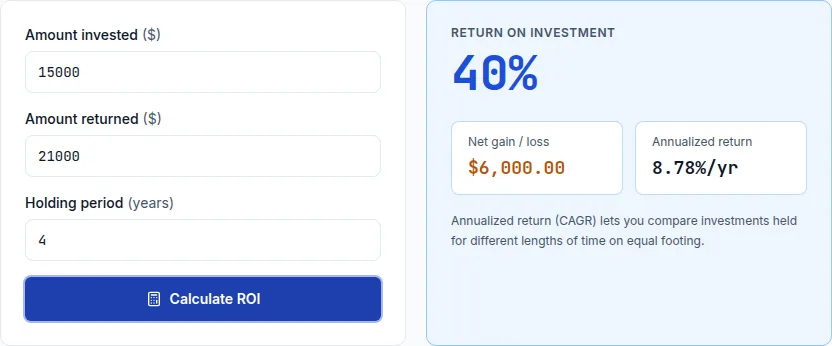
Annual rate of return (CAGR) = (ending value ÷ starting value)^(1 ÷ years) − 1. $15,000 grown to $21,000 over 4 years is a 40% total return, but only an 8.78% annualized rate — the number that actually lets you compare this investment against one held for a different length of time.
Why total return alone is misleading
A 40% total return sounds identical whether it happened over 1 year or 10 years, but those are wildly different performances — 40% in a single year is exceptional, while 40% spread across a decade is fairly ordinary. Annual rate of return solves this by converting any total return into 'the steady yearly rate that would have produced the same result,' making returns from different holding periods directly comparable.
$15,000 growing to $21,000 over 4 years: total return is (21,000 − 15,000) ÷ 15,000 = 40%. Annualized: (21,000 ÷ 15,000)^(1/4) − 1 = 1.4^0.25 − 1 ≈ 0.0878, or 8.78% per year.
Using it to compare investments fairly
An 8.78% annualized return is the number to stack up against other investments' annualized returns, regardless of how long each was held — a 25% total return over 2 years (≈11.8% annualized) actually outperformed the 40%-over-4-years example above on a per-year basis, despite looking smaller as a headline total-return number.
This is also the correct way to compare an investment's performance against a benchmark like the stock market's long-term historical average (commonly cited around 10% nominal annually) — comparing a multi-year total return directly against a single-year benchmark figure isn't a fair comparison without first annualizing.
A caveat: it assumes steady growth
CAGR describes the equivalent steady rate, not the actual year-by-year path — an investment could have dropped sharply in year 2 and rebounded in year 3, and the annualized figure wouldn't show that volatility at all, only the smoothed average. For understanding risk (not just return), the annualized number needs to be paired with some sense of how bumpy the actual ride was getting there.
Related guides
Put it into practice
The fastest way to learn the math is to play with the numbers.
Open the ROI Calculator